» Wastewaters in Syria

WASTEWATER TREATMENT IN SYRIA

Dr.Eng. Abdulrzzak Alturkmani

1- General Background

Geography and population

Syria, with a total area of 185180 km², is bordered in the north by Turkey, in the east and southeast by Iraq, in the south by Jordan, in the south-west by Israel and in the west by Lebanon and the Mediterranean sea. Administratively, the country is divided into 14 governorates, one of which being the capital Damascus. The country can be divided into 4 physiographic regions:

– The coastal region between the mountains and the sea;
– The mountains and the highlands extending from north to south parallel to the Mediterranean coast;
– The plains, or interior, located east of the highlands and including the plains of Damascus, Homs, Hama, Aleppo, Al-Hassakeh and Dara’a;
– The Badiah and the desert plains in the south-eastern part of the country, bordering Jordan and Iraq.

Syria has nearly a total population of about 18 million (2005) with a high growth rate of 3.1% per annum.

Climate and water resources

– Climate

 Syria’s climate is Mediterranean with continental influence: cool rainy winters and warm dry summers, with relatively short spring and autumn seasons. Large parts of Syria are exposed to high variability in daily temperature. The maximum difference in daily temperature can be as high as 32°C in the interior and about 13°C in the coastal region. Total annual precipitation ranges from 100 to 150 mm in the north-west, 150 to 200 mm from the south towards the central and east-central areas, 300 to 600 mm in the plains and along the foothills in the west, and 800 to 1000 mm along the coast, increasing to 1400 mm in the mountains. The Average annual rainfall in the country is 252 mm giving 46.6 km³.

– Water resources

There are 16 main rivers (6 are international rivers) and tributaries in the country. The natural average surface runoff to Syria from international rivers is estimated at 28.73 km³/year. Total natural average outflow from Syria is 31.975 km³/year, a breakdown of surface water entering, bordering and leaving the country is given in the Table 1.

Table 1 Major rivers entering, bordering and leaving Syria (FAO, 1997)

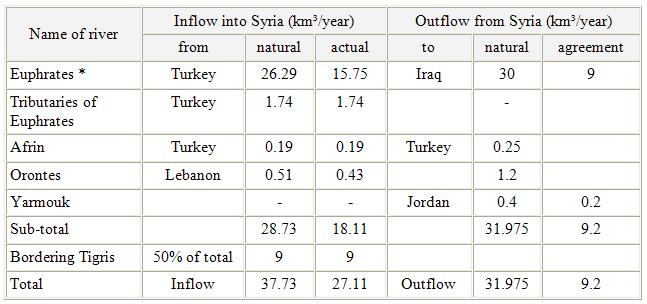
* Turkey has unilaterally promised to secure a minimum flow of 15.75 km³/year at its border with Syria.

Although figures for water resources are very difficult to obtain due to the lack of reliable data, it can be estimated that water resources generated from rain falling within the country amount to 7 km³/year. Groundwater recharge is about 4.2 km³/year, of which 2 km³/year discharges into rivers as spring water. Total groundwater inflow has been estimated at 1.35 km³/year, of which 1.2 km³ from Turkey and 0.15 km³ from Lebanon. Although not quantified, the amount of groundwater flowing into Jordan may be significant.

Dams and lakes

There are about 141 dams in Syria with a total storage capacity of 15.8 km³. The largest dam is located at Al-Tabka on the Euphrates. It forms the Al-Assad lake with a storage capacity of 11.2 km³. Medium-sized dams include the Al-Rastan (225 million m³), the Mouhardeh (50 million m³) and the Taldo (15.5 million m³). There are some 20 dams classified as small, the largest of which is the Dara’a, with a storage capacity of 15 million m³. The majority of these dams are located near Homs and Hama. Apart from the Al-Assad lake, there are five lakes in Syria, the largest being lake Jabboul near Aleppo with a surface area of about 239 km². Lake Qattineh near Homs is the main perennial lake in Syria.

Water withdrawal

Total annual water withdrawal in Syria in 1993 was estimated at 14.41 km³/year, of which agricultural use accounted for 94.4% (3.7% is withdrawn for domestic use and 1.9% for industrial use). The assessment of agricultural water use is based on the assumption that the maximum water requirement is about 13 450 m³/ha per year. The treatment of domestic wastewater is carried out mainly in the towns of Damascus, Aleppo, Homs and Salamieh. The total amount of treated wastewater was estimated at 0.37 km³/year in 1993, which represents 60% of the total produced volume of 0.61 km³/year. Figure 1 shows amounts of water uses in Syria.

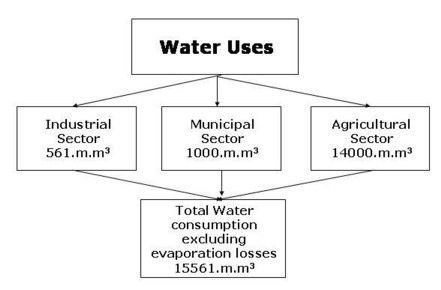
Note: m. m³ (million cubic metre )

Fig. 1 Water uses in Syria , (Ali & Yasser 2004)

2- Domestic Wastewater
Quantities and qualities 
In Syria, Domestic wastewater flow is considered 80% of drinking water consumption which is 190 L/Capita.d in cities and 120 L/Capita.d in villages (GCEC, 2001). In general , domestic wastewater flow is variable and flow pattern will change hourly, daily and even seasonally. Domestic wastewater is usually of a predictable quality and quantity. The general quality of raw domestic wastewater, secondary effluent and tertiary effluent in Middle East are  presented in Table 2.
Table 2 The general quality of raw domestic wastewater, secondary effluent and tertiary effluent in Middle East (Mamta, 1999)
Contaminants
Raw Wastewater
Secondary Effluent
Tertiary Effluent
Temperature  (C)
30-40
pH
6-8
6-8
6-8
Chemical oxygen demand COD
600-900
Biochemical oxygen demand BOD
250-350 (*)
20-30
10
Total solids
1500-2000
300-500
100-200
Total suspended solids
200-300 (*)
20-30
10
Volatile suspended solids
150-250
Sulfate  SO4
200-400
Sulfide
5-20
0
Grease / Oil
30-50
0
0
Residual chlorine
0.5-1
Ammonia (as N)
30-50
10-15
(*) In Syria  BOD5 = 400-500  mg/l , SS = 500-650 mg/l
About 68.6 % of houses in Syria are served by sewerage, this means that 30 % of people are not served. As a result diseases can be expected because of using untreated wastewater as shown in table. Using of untreated wastewater causes diseases for citizens as shown in Table 3.
Table 3 Infected inhabitants by diseases because of the use of untreated wastewater  (ESS, 2005)
Disease
2000
20001
2002
2003
2004
                Hepatitis/A
3576
4166
4050
2843
2929
                  Typhus
5101
5781
4777
4169
4747
 Acute infectious Diarrhea
100146
121323
147765
158003
199556
*  Treatment plants in Syria
As  population growth  increased rapidly , growing water demand for drinking, municipal and industrial purposes, and rising demand on food, the Syrian government adopted a range of measures necessary for implementing a large-scale programme in order to establish wastewater treatment plants in all Syrian provinces. Figure presents locations of wastewater treatment plants in Syria. Figure 2 shows locations of most wastewater treatment plants (WWTPs) in Syria.
Fig. 2  Wastewater Treatment Plants positions in Syria, (Ali & Yasser 2004)
Table 4 presents general information related to WWTPs in Syria for large cities, and the approximate cost of rural treatment plants for 500 m³/d influents and about 6250 inhabitant is shown in Table 5. The wastewater treatment plant in Homs shows in Figure 3.
  Table 4    Wastewater treatment plants in Syria, (GCEC, 2001)
Fig. 3 Activated sludge treatment plant in Homs city. (GCEC, 2001)
Table 5 Wastewater Treatment Plants Costs for 6250 Inhabitants.  (ESS, 2005) Syria
Treatment plant type
Construction cost
per inhab.
Running cost
per inhab./a
Specific surface
m² per inhab.
Stabilization
ponds
1.785 SP/inhab.
29,74 Є/inhab.
192 SP/inhab. a
3,5 Є/inhab. a
1,6 m²/inhab.
Aerated
Lagoons
1.137 SP/inhab.
18,93 Є/inhab.
346 SP/inhab. a
5,7 Є/inhab. a
1 m²/inhab.
Conventional activated sludge
1.501 SP/inhab.
25,01 Є/inhab.
230 SP/inhab. a
3,84 Є/inhab. a
1 m²/inhab.
Extended
aeration
1.522 SP/inhab.
25,35 Є/inhab.
288 SP/inhab. a
4,8 Є/inhab. a
1 m²/inhab.
Stabilization
ponds*
429 SP/inhab.
7,15 Є/inhab.
25 SP/inhab. a
0,41 Є/inhab. a
2,1 m²/inhab.
Constructed Wetland
858 SP/inhab.
14,3 Є/inhab.
55 SP/inhab.
>1 Є/inhab.
0,5 m²/inhab.
3- Industrial Wastewater
     The wastewater from industries varies so greatly in both flow and pollutional strength that it is impossible to assign fixed values to their constituents. It may be necessary to pretreat the wastes prior to release to the municipal system or to fully treat the wastes and discharge directly to surface or ground waters. One of the primary objectives of a sewerage authority will be to control the discharge of industrial wastewater to sewers as well as to domestic sewage. There are technical requirements necessary to achieve effective control of these wastewater in order to protect the sewerage network , the sewage treatment plant and receiving water (lakes, rivers). Industrial wastes may cause all types of pollution as follows:
1. Pollution by toxic compounds such as heavy metals, lead, copper and zinc, etc… from electroplating and metal manufacture.
 2. Pollution by biologically non degradable organic compounds such as detergents, antibiotics and drugs which may have undesirable physical chemical properties or create tastes and a dour in the water.
3. Pollution by plant nutrients (nitrogen, phosphate and potash) which may encourage plant, algal and plank tonic growth having an undesirable effect on water quality, these pollutants may be associated with conventionally purified sewage effluents.
4. Pollution by inorganic salts increasing the salinity of the water.
5. Pollution by bacteria viruses or parasites of public health significance.
     Syria contains a large range of industries such as: iron and steel, inorganic chemical, oil refining, food, etc. Wastewater produced by industries can be significantly different, even among industries making the same product, depending up on the process used. Each type of industrial wastewater has some of the major treatment processes which are commonly used for it.
Few factories in Syria have wastewater treatment plants, which discharge the treated water according to the national legislation related with the quality of the effluent for each industry.
     There are a lot of alternatives for treatment of industrial wastewater such as discharging to a publicly owned treatment works (POTW) to be combined with municipal wastes, pretreatment by industry, followed by discharge to a (POTW), and the treatment by industry to the extent required before discharge to receiving water. Some analysis of factories effluents in Syria shown in Table 6.
*  Industrial wastewater flowrates:
         Wastewater flow rates from industrial sources vary with the type and size of the facility, the degree of water reuse, and the onsite wastewater treatment methods. Extremely high peak flowrates may be reduced by the use of detention tanks and equalization basins. Typical design values for estimating the flows from industrial areas that have no or little wet-process type industries are (9 to 14  /ha.d) for light industrial developments and (14 to 28 /ha.d) for medium industrial developments. For industries without internal recycling or reuse programs, it can be assumed that about 85 to 95 percent of the water used in the various operations and processes will become wastewater. Average domestic wastewater contributed from industrial facilities may vary from (30 to 95 L/capita.d). Typical constituent data from two industrial operations are presented in Table (6). From this data, it can be observed that flow values and water quality measurements may vary over several orders of magnitude over a period of a year. Because of this variation, it is often difficult to define ” typical operating conditions” for industrial activities. The Syrian Arab Organization for Standardization and Metrology (SAOSM) has issues the limitation of discharged liquid wastes of economic activities in sewer network in (10106/2002).
Table 6  Industrial effluents quality of some factories in Syria. (GCEC, 2001)
Industry
BOD5
SS
F
COD
NO3
NO2
NH4
PO4
SO4
pH
T
Fertilizer
103
1.3
228
26
1.8
152
0.77
113
1615
7.8
33
Vegetable Oil
1875
650
4800
7400
12
33
Sugar Factory
1014
148
1970
1316
7
32
Dairy Products
2100
235
9000
3020
7.4
27
Dyeing&
Weaving
180
172
520
3.11
1
1570
11
22
Wool & Cotton
550
774
4080
2450
9.6
24
Wheels factory
105
65
154
7.6
5.4
900
7.9
21
Iron pipes Factory
120
196
1280
20450
2.4
Thermal Power Station
42
140
90
3.7
1.1
1400
7.1
30
* Adapted from Industrial Pollution Control Report that issued by the General Company of   Engineering & Consulting ,Syria 2001.
References
1- Abdulrzzak Alturkmani, Dairy Industry Effluents Treatment, Thesis. UTCB University, Bucharest-Romania 2007
2- Ali Kaisi & Yasser Mohamad, “ Non-Conventional Water Use In Syria”, Syria 2004.
3- (ESS) Ecological Sanitation Symposium, “ Constructed Wetland Experiences From a Pilot Project ”, Harran Al-Awamied. Syria 2005
4- Mamta Tomar, “ Quality Assessment of  Water and Wastewater “, USA 1999
5- Syrian Environmental Affairs Commission (SEAC), “ Country Data & Domestic Economy Report “. Syria 2000
6- (FAO) Food and Agriculture Organization of the United Nations. “Information System on Water and Agriculture, Syria “.1997
7- Syrian Ministry of Agriculture and Agrarian Reform, Directorate of Irrigation and Water Uses reports.
8- Syrian Ministry of Housing and Public services, Directorate of Water Supply and Waste Water reports.
9- (SAOSM) The Syrian Arab Organization for Standardization and Metrology . “ Syrian Limits of Wastewater Reuse ”. 
10- (GCEC) The General Company of  Engineering and Consulting. “The Comprehensive Study for Pollution Prevention in Alasi Basin ”. Syria 2001